Satellite Imagery: 1970s - 2000s
Our
primary remote sensing platform and sensor system is the Landsat
Thematic Mapper. This system views the landscape at a 30 meter
cell resolution (Thematic Mapper's predecessor, Multispectral Scanner,
scanned at 79 meters) for for its optical channels, and offers
relatively large geographic coverage for each collected image or scene,
roughly 185 square km. Both the grain and extent of Landsat are useful
for assessing human imprints on the land indicative, for example, of
population settlement patterns, land clearing for the cultivation of
crops, and a host of other land transformations that have important
population-environment signatures and cause and consequence
implications for examining LULC dynamics.
|
Landsat Multispectral Scanner (MSS)
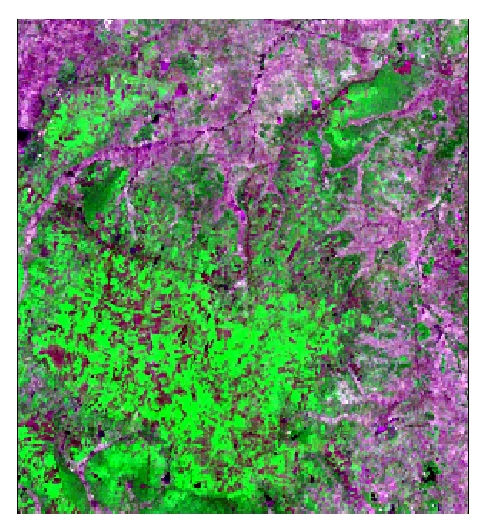
The image below is a
2-4-1 composite from December 28, 1985, where visible green is shown in red, near infrared
(highly responsive to healthy vegetation) is shown in green, and
visible blue is shown in blue.
This combination helps highlight upland
field crops and more cleared rice growing areas in colors that closely
approximate true colors. The bright green areas in the southwest
represent upland field crops, such as cassava and sugar cane. The
darker green patches to the east and north of the image indicate medium
density forest. The purple and pink regions throughout the image are
areas of rice cultivation. During the dry seasons, when the rice paddys
are not inundated, the rice has been harvested, leaving a bare
landscape with short grasses. When compared to the Landsat Thematic
Mapper (TM) image to the right, the Multispectral Scanner image looks
blurry, making the coarseness of the MSS's 79 meter pixel is easily
noticeable.

Landsat Enhanced Thematic Mapper (ETM)
Much like Landsat Thematic
Mapper, the Enhanced Thematic Mapper sensor collects data about the
Earth's surface in 6 bands: 3 visible, 1 near-infrared, and 2
middle-infrared. As such, the information that can be gleaned and
derived using ETM is very much the same as that of TM.
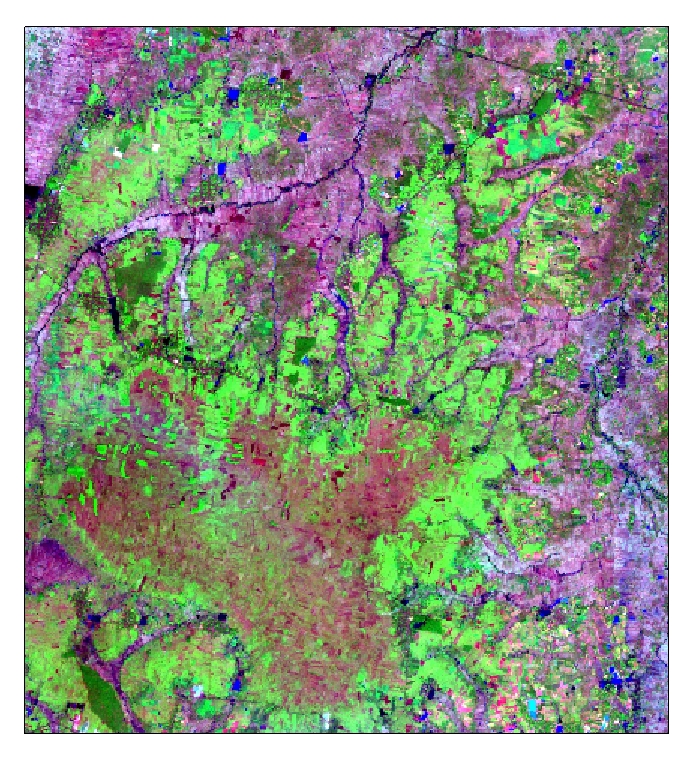
The image below, from December 27,
1999, is of the same region and band combination as the TM image to the upper right.
However, the ETM image was collected 4 years later. As is clearly
visible, marked changes have occured in the intervening years.
Without the broad, regional view offered by the Landsat sensors, such
information would be significantly more difficult to detect. This
is one of the many benefits of using remote sensing to track, monitor
and predict changes on the landscape.

|
Landsat Thematic Mapper (TM)
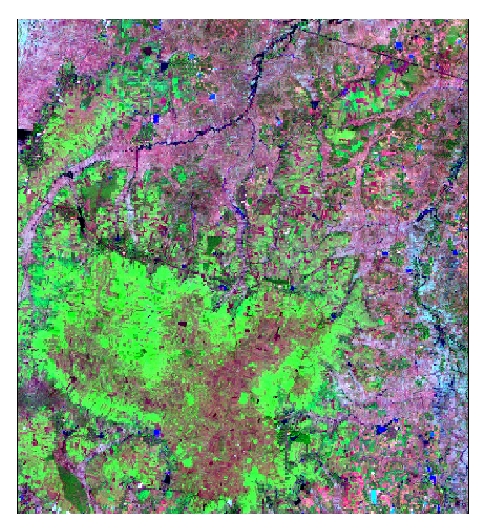
The image below is a 7-4-2
composite from December 24, 1995, where mid-infrared (highly repsonsive
to rock and geologic formations) is shown in red, near infrared (highly
responsive to healthy vegetation) is shown in green, and visible green
is shown in blue.
This combination helps
highlight upland field crops and more cleared rice growing areas in
colors that closely approximate true colors, with plants showing up as
green, bare soil showing up as red and brown, and water showing up as
blue. The bright green areas in the southwest represent upland
field crops, such as cassava and sugar cane, while the darker
brownish-red area in the south-central part of the image represent
harvested field crops. The darker green patches to the east and
north of the image indicate medium density forest. Again, the
extensive purple and pink regions throughout are areas of rice
cultivation, which has been harvested at the start of the dry season.

Landsat Enhanced Thematic Mapper (ETM), Panchromatic
In
addition to the multispectral scanning capabilities, the ETM sensor
added a 15 meter panchromatic (black-and-white) band. Given its
improvement in resolution, the panchromatic band can be effectively
used as a compliment to the multispectral bands, through resolution
merges or band-stacking. Alternatively, the merits to using the
panchromatic band alone are myriad.
Below, the panchromatic band from
December 27, 1999 is shown. Though the image is of a somewhat
smaller region than the others on this page, the improvement in spatial
resolution is apparent. Features on the ground are more
discernable owing to the increased sharpness of the image.
|
|
|

