Raster GIS Data
The
following table lists the raster GIS data in the Nang Rong Project's
spatial database. Data layers range from satellite gathered
imagery, to non-imagery grids relating to landscape and terrain
features, to scanned topographic maps. The imagery was acquired
and processed in order to render it usable within the database, while
scanning and GIS based analyses were utilized in the derivation of
other raster datasets. In other instances, existing raster data
was acquired, if available. For some of the data, click on the
link to view a thumbnail overview. However, since some of the
layers contain or depict sensitive locational data, they are
confidential, and their use is restricted.
| Imagery Raster Data |
Satellite Imagery
|
Landsat Multispectral Scanner (MSS): Landsat MSS
was the primary sensor during the 1970s and early 1980s. It has a
spatial resolution of 79 meters, and a spectral resolution of 4 bands:
3 visible, and 1 near infrared. Much like all Landsat products,
it provides an excellent region view of the study site. The Nang
Rong Project has 8 MSS scenes in its holdings.
|
Thumbnail View
|
| Landsat Thematic Mapper (TM): Landsat
TM, the next sensor in Landsat's evolution, increased its spatial
resolution to 30 meters, as well as adding 2 middle infrared and 1
thermal band to its spectral suite. TM is invaluable in examining
and analyzing the landscape dynamics in the late 1980s through the
1990s. The Nang Rong Project has 30 TM scenes in its
holdings.
|
Thumbnail View |
| Landsat Enhanced Thematic Mapper (ETM):
Landsat ETM, the latest Landsat sensor, began collecting imagery in the
late 1990s. Its resolution is the same as that of TM, but
it adds a 15 meter panchromatic (black-and-white) band. The
panchromatic band complements the standard suite of multispectral bands
quite well, allowing sharper, more crisp images to be derived. The
Nang Rong Project has 12 ETM scenes in its holdings. |
Thumbnail View |
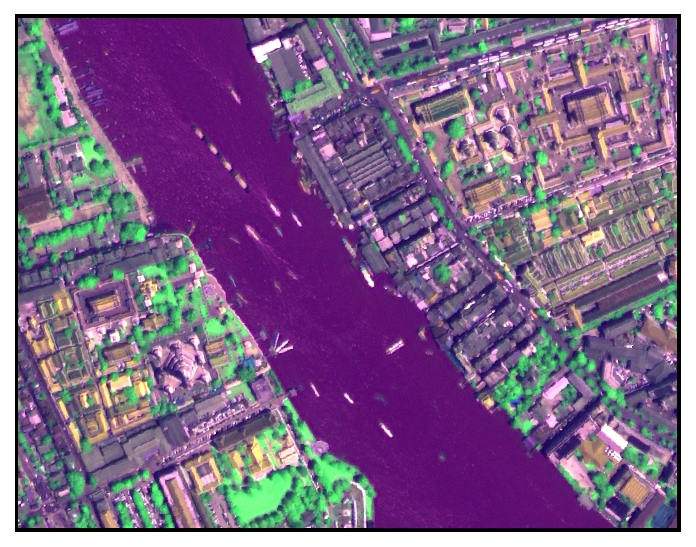
IKONOS:
Space Imaging's IKONOS sensor collects imagery in 5 bands: 3 visible, 1
near infrared, and 1 panchromatic. The multispectral channels
have a spectral resolution of 4 meters, while the panchromatic collects
at 1 meter. Combining the multispectral with the panchromatic
allows for heightened detail and analysis. The Nang Rong Project
has 2 IKONOS scenes, for portions in downtown Bangkok, in its inventory.
|
Thumbnail View |
Aerial Photography
|
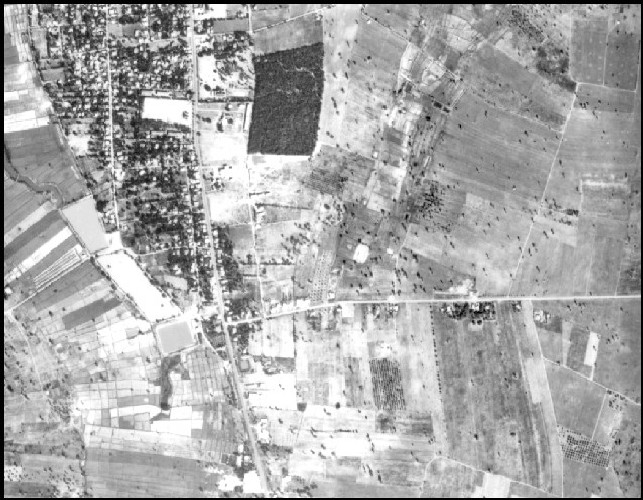
Air Photos:
The inventory of aerial photographs stretches back to the 1950s through
the 1990s. Presently, there are 3252 separate
photographs, as well as mosaics for each decade. The scale of the
photos ranges from a relatively coarse 1:50,000, to a much finer
1:6000 for a small section in the district. While features are easily identifiable from air photos, a
lack of multispectral information prohibits higher level image
processing. The Nang Rong Project has air photos spanning nearly
half a century: 1950s, 1960s, 1970s, 1980s (1:15,000 and 1:40,000), and
1990s.
|
Thumbnail View
(1984)
|
Non-Imagery Raster Data
|
| Digital Raster Graphics (DRGs) |
Thai Ministry of Defense Maps:
A set of 36 1:50000 scale Thai Ministry of Defense maps were scanned,
registered, and rectified. Of the 36 maps, 11 of them fall either
within the boundary of Nang Rong district, or are adjacent to maps that
contain portion of the district. The remaining 25 fall well
outside the district, but are useful in providing a broader, regional
perspective of Nang Rong.
|
Thumbnail View
|
| Land Use/Land Cover (LULC) Data
|
LULC Grids: Nearly the entire inventory of Landsat images has been classified into both Land Use and Land Cover types.
A hybrid supervised and unsupervised classification approach was
utilized, with several post-processing techniques applied to increase
accuracy. "Land Use" and "Land Cover" are similar, but differ
slightly in their specificity. "Land Use" is more general,
describing the broad categories of use, such as rice or field crops,
that humans have introduced on the landscape. "Land Cover",
however, is more specific, describing the physical cover of the land,
independent of a human element. Examples of "Land Cover" are
inundated and burned rice, and emergent field crops.
|
Thumbnail: Use
Cover
|
Topographic and Terrain Data
|
Digital Elevation Model (30 meter):
The 30 meter elevation model was derived from the 10 meter contour
lines that were digitized from the 1:50,000 scale Thai Ministry of
Defense maps. This moderate resolution 30 meter DEM has been the basis for a number of
derivative datasets, some of which are listed below.
|
Thumbnail View
|
| Digital Elevation Model (90 meter):
A second DEM, with a resolution of 90 meters, was acquired through the
Shuttle Radar Topography Mission (SRTM), a joint project between the
National Geospatial-Intelligence Agency
(NGA) and the National Aeronautics and Space Administration
(NASA). SRTM used a method called radar interferometry,
whereby radar images taken from slightly different locations allow for
the calculation of surface elevation. Though the resolution of
the SRTM dataset is more coarse than the 30 meter DEM, it still
provides a useful regional perspective. |
Thumbnail View |
Flow Direction:
This data layer, derived from the 30 meter DEM, shows the flow
direction from each cell to its steepest downslope neighbor. Flow
direction is useful for several other analyses, such as watershed
modeling and flow accumulation.
|
Thumbnail View |
Landforms:
Derived from the 30 meter DEM, this data layer breaks the landscape
into 6
distinct terrain classes. The classes are: Alluvial Plain,
Lowland Terrace, Middle Terrace, High Terrace, Uplands, and Broken
Uplands. Since land use practices in Nang Rong are highly
dictated by terrain, this grid is helpful in understanding land use
decisions.
|
Thumbnail View |
Slope:
Slope was derived from the 30 meter digital elevation model.
Agricultural practices in Nang Rong are limited by water resources and
terrain. As such, slope helps determine the availablity of usable
water and suitable arable land.
|
Thumbnail View |
Wetness Index:
A derivitive product of the 30 meter DEM, the Wetness Index combines
shape measures of several landscape elements to quantify the
availability of water. The Wetness Index incorporates such
elements asslope, relative slope postion, aspect, and flow accumulation.
|
Thumbnail View |
|
|
