The last section discussed one of the major ways we learn about people - the survey. Here we take a look at an equally important means of learning about the surface of the earth - remote sensing using satellites and air photos.
|
Views from Space
As satellite-based images of the earth's surface and mapping programs like MapQuesttm and Google Earthtm become more popular, the practice of remote sensing has become less foreign than it once was. Many people are now aware that satellites capture images of nearly every square foot of the earth, but few may really understand exactly how those satellites work, what steps are needed to create the images we see, and what other types of information satellites can provide.
The idea of satellite imagery, or remote sensing as it is usually called, is nothing new at all. Aerial photography from airplanes has been around since almost the beginning of motorized flight. What has changed in the space-flight era is the extent of what can be done and learned with satellites that is impossible with aerial photographs.
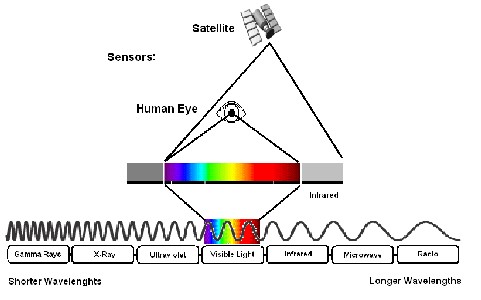
ABOVE: The human eye, while an amazing sense organ, is still no match for the onboard arrays of remote-sensing satellites, which can detect visible light and infrared light. In addition to these radiation wavelengths, there are many others that make up the full electromagnetic spectrum.
It's All Just Radiation
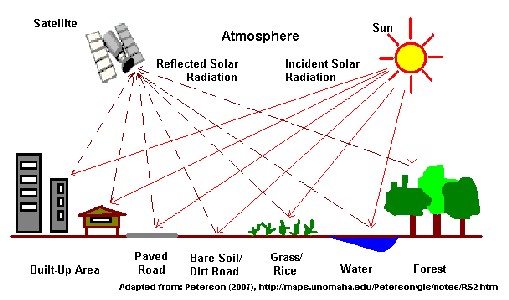
You may recall from your middle school or high school science class that visible light - in all the colors of the rainbow - is made up of many different wavelengths of solar radiation, or radiation from the sun, which in turn make up only a small slice of the total electromagnetic spectrum that includes the radiation used in radios, X-ray machines, and microwaves. Red light, at one end of the visible spectrum, has a longer wavelength, and purple or violet light, at the other, has a shorter wavelength. In addition to the light that we can see, or sense, with our eyes, the sun emits non-visible radiation. If this radiation has a longer wavelength than that of visible light, it may be called infrared radiation. If it has a shorter wavelength than visible light, it may be called ultraviolet, or UV radiation. This is the same UV radiation that has been linked to skin cancer.
Everywhere you look, solar radiation is reflecting off nearly every object it strikes, sometimes bouncing back and forth many times. If your eye intercepts this radiation, and it is in the visible range of the spectrum, you have the experience of "seeing" an object. If the radiation is of some other frequency, you cannot see it, but special instruments built and placed on orbiting satellites can "see" this light.
An aerial photograph, taken from a plane flying slowly overhead, captures the visible radiation that reflects off the earth's surface. It allows us to detect objects and shapes on the earth's surface, like trees, buildings, lakes, and even hills. Aerial photographs are easier to interpret because the information contained in them is the same as what we would see from the plane. A satellite image, on the other hand, contains information about types of radiation that we cannot actually see.
ABOVE: A remote-sensing satellite gathers reflected light from many surface objects, each reflecting a different combination of wavelengths that may be used to identify the object.
What's the Difference?
Why is the ability to "see" this other radiation important? Every object on the surface of the earth reacts differently to various types of radiation, absorbing some frequencies and reflecting others. Our eyes and nervous system are very good at detecting those frequencies that reflect back at us, and depending on the combination, we see this light as red, blue, yellow and so on. Some objects that absorb the exact same combinations of visible radiation absorb different amounts of infrared radiation, allowing us to tell the difference between the objects. Having a record of just the visible radiation, as in an aerial photograph, would not allow us to distinguish between these objects. Equally important, some types of radiation, like visible light, are dispersed or blocked by clouds in the atmosphere. On a particularly cloudy day, all or most of the visible light reflected from the surface of the earth would not be detectable - instead all one would see are clouds and more clouds. It is especially difficult to obtain remote imagery during the rainy season when clouds may cover the landscape for much of the time. Using the additional non-visible radiation, combined with frequent attempts to obtain images helps us get around the cloud problem to some extent, but even with the best technology, we usually get a few clouds in any image.
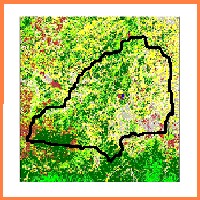
As another example of the advantages of satellite imagery, the additional information detected by a satellite can actually allow us to calculate not only how green a patch of forest is, but approximately how much moisture is contained in the foliage of the forest canopy. Satellites can detect the presence of chemicals like carbon dioxide in the earth's atmosphere and determine the temperature above the surface of land and sea, among other things. Such measurements were not possible before satellites came along. The image on the left below is an aerial photograph of a region in Nang Rong. On the right is a satellite image of the same region. Notice how the right of the satellite image is colored green and the left of the image is mostly pink. Also notice how the blue areas (water) stand out sharply against the background. These colorings indicate differences in the types of radiation being reflected back to the satellite from earth's surface that are not as easily detected in an aerial photograph. Even if the photograph were in color, many of these differences would be difficult to notice.
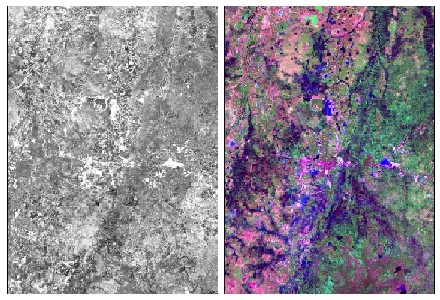
ABOVE: A satellite image can reveal more information about a landscape than an aerial photograph. It does so by taking advantage of infrared and other radiation wavelengths that humans cannot perceive with the naked eye.
It's Classified
One of the most interesting questions that we have worked to answer about Nang Rong is what has happened over time to the forests and countryside. One way to answer this question might be to simply ask people about changes to their land. We used this approach in 1994 to get a general sense of which villages had experienced deforestation. However, while people are quite good at recalling general trends, their memory for details such as how much forest was gone, where exactly it had been, and how long ago it had disappeared, tends to be very poor. As an alternative, one might send out a team of researchers to visually inspect the landscape, maybe even to count trees. But, while such methods might work on a small scale, they are much too costly to be used over a large area like Nang Rong District, the whole country of Thailand, or even the entire world.
Remotely sensed images, both aerial photography and satellite imagery, offer us a comparatively cheap and easy way of learning about the surface of the earth, or land cover, for large regions. Even more importantly, the nearly 40 years of satellite images and perhaps 50 to 80 years of aerial photographs that are available allow us to peer back into time without relying on people's memories, which could be unreliable.
On our project, we use special computer programs and a variety of other tools to classify regions of the earth's surface according to the types of vegetation or other land cover on them. As suggested above, we are limited to interpreting the visible appearance of the land when working with aerial photographs, but when classifying satellite images we are able to take advantage of all that additional information to produce very detailed images of the earth's surface grouped by what is covering the land. The result is a simplified image showing the many different types of land cover present in an area.
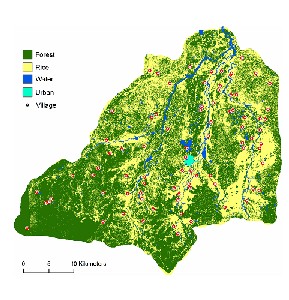
In the two images below, you may be able to recognize the outline of Nang Rong District that you first saw in Section 2. Each color in this image represents a different land cover - dark green is forest, yellow is rice fields in different stages of growing, the light blue spot in the middle is the urban area of Nang Rong Town, and the dark blue is water. From the lack of water over the surface, you should be able to deduce that this image was not taken during the wet season, or else much of the yellow and gray areas would be covered in water!
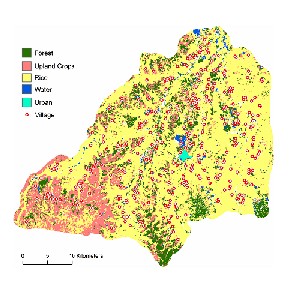
The image on the left was taken in Nang Rong in 1954. Notice how much of the region is still covered with forest. The rice land is confined to areas close to the rivers. The image on the right was taken in 1999. Notice the additional color, or class of land cover called upland crops. These are plants that can be grown on the slightly higher and drier lands found in the Southwest of the district. Cassava, a crop that you learned about in Section 3, is one example. With images like this, we can tell exactly what was growing on the surface of the earth at any place in Nang Rong for any point in time when we have an image. By looking at a series of images over time, we can detect trends - deforestation, reforestation, the conversion of one land cover type (like rice fields) to another (like urban/paved areas). And using the social survey data described in the Last Section, we have a better understanding of what was occurring with the population of Nang Rong when such changes occur. By combining social and spatial data, we are in a position to form theories about why and how changes occurred in the land cover of Nang Rong, and to test these theories against the facts. In a later section, you will be able to develop and test your own theories, and learn more about our specific findings. But first, we have to look more carefully at how humans and their behavior are linked to specific places on the surface of the earth.
|
|