So far, we have learned about two very different ways of gathering information about a place and the people who live there - asking people good questions in surveys or interviews and using remotely sensed information from satellites and aerial photographs. We then explored creative new ways to combine these data, focusing on linking up people and places. In this section, we look at a powerful method of combining all this information into a single format that allows us to see the spatial relationships between things. This method also allows us to include information from other sources besides those discussed here, such as government statistics on agriculture, weather, or just about anything else.
|
A Sharp Tool
The tool is called a Geographic Information System, but to call it just another tool for doing research may be unfair. A GIS, as it is usually called for short, is much more than just a software package or set of programs for crunching numbers. A GIS forces us to think about the relationships between things on the earth's surface in a way that is both new and also very easy to understand. As already alluded to, it allows us to combine many different types of information into a single, easy-to-interpret configuration. The only requirement is that every piece of information that goes into the GIS must specify where it is found on the earth.
Every conceivable thing that can be measured according to its position, a process known as georeferencing, can be included in a GIS. Once a point has been georeferenced, whether that point is your home, a famous landmark, a lamppost, or perhaps something that is not even a point, like a river, lake, or an entire desert, it is ready to be entered into a GIS. But what exactly is georeferencing? One common system used to georeference places on the earth's surface that you may be familiar with is latitude and longitude. Every place on earth has a unique combination of latitude (north and south, or up and down) and longitude (east and west, or sideways), represented by a pair of measurements that distinguish it from every other. Nang Rong town, in the center of Nang Rong district, has latitude 14° 38' north of the equator and longitude 102° 47' east of the Prime Meridian that nearly runs through Greenwich, England. The landmark called the "Old Well" in the center of the campus of the University of North Carolina at Chapel Hill has latitude of roughly 35° 55' north and longitude of 79° 3' west. Use the following like to find the latitude and longitude of your school or home address: http://stevemorse.org/jcal/latlon.php.
Of Cakes and Sandwiches
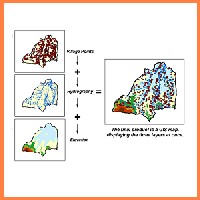
Each type of information that goes into a GIS becomes a layer, like the layers of a cake, except that you can see through them. Points or regions that share the same coordinates, or georeferenced position, overlap. Remember that every single object and space entered into a GIS has exact coordinates of some type to tell the user and the computer where it is and what is near it. When all of the layers are displayed together, it is very easy to see the spatial relationship between objects that are parts of different layers. To see how this works visually, take a look at the figure below.
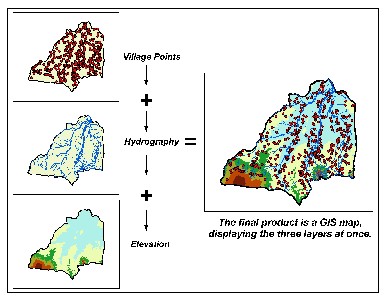
ABOVE: Like a sandwich, or the layers in a cake, different layers of information in a GIS combine to provide new information that did not exist in any single layer.
Each of the small maps of Nang Rong District on the left represents a different layer of information, in this case the location of villages, the location of rivers and streams or hydrography, and elevation coded by color. These three layers can be combined to create the map at the right which shows all three layers simultaneously. And because each layer retains the exact georeferencing, or position of every object, we can now easily answer questions like "how many villages are within 1 mile of a major river?" or "how many villages are above a certain elevation?" To answer the first question, we could imagine putting a circle around each village that has a radius of 1 mile and then counting any village whose circle touches a river. These circles are called "buffers" and are very useful in answering questions about distance. In a GIS, we can actually ask the computer to perform such a task. Creating buffers and many other tasks are relatively simple in a GIS, but would be very time consuming and difficult with traditional paper maps.
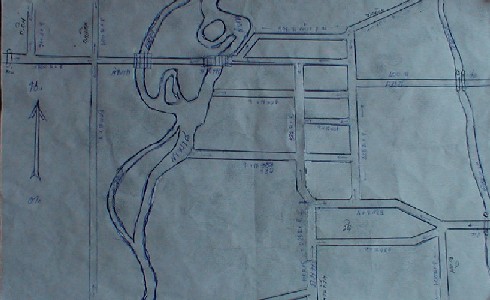
ABOVE: Before GIS and other methods of digital mapmaking came along, maps had to be either hand-drawn or printed. Prior to the late 1990s, the Nang Rong project made frequent use of hand-drawn maps like this one to aid us in understanding spatial relationships.
Spatial Analysis
The ability to answer questions like those above about the spatial relationship between objects in different layers is a powerful feature of a GIS. Another major ability that a GIS offers is the ability to store nearly unlimited information about features in the various layers. So, a layer of points on a map representing the locations of houses could include information about the people living in each house. The number of individuals living there, their average age, annual household income, racial composition, and many other characteristics could all be attributed to that single point. Any of these attributes could then be used in further explorations, such as identifying whether households containing individuals of a certain race or income level tend to be concentrated in certain areas, or dispersed randomly throughout a region.
The few examples described here do not even scratch the surface of what can be done with GIS. It is not surprising, then, that GIS has quickly become a standard tool in many scientific fields beyond geography, including environmental science, engineering, biology, sociology, criminology, health sciences, anthropology, and so on. GIS technology has proven equally useful in many trades, including construction, surveying, city management, forestry, wildlife management, sales and marketing, agriculture, and the list goes on!
We are continually finding new uses for GIS technology on our project, and the technology sometimes seems to be developing more quickly than we can even keep up with. Over the next few sections, we are going to look at three examples of ways that we use GIS to bring together the many pieces of our project in ways that allow us to answer important questions better than we ever could before.
|
|