In this section we tackle the problem of connecting people to the landscape so that we can study the relationship between them.
|
A Basic Problem
People are mobile beings. We move from place to place over the course of a day, a year, and a lifetime. Have you lived in the same house your entire life? Have you been on vacation recently? How many different locations have you visited this week, or even today? The more places you visit, the broader your impact on the natural and human-created environments may be. At the same time, you most likely have the greatest impact on those places you inhabit or interact with on a regular basis. Every time you mow the lawn or throw away trash that will end up in a landfill, you alter the surface of the earth in a way that can be detected by the methods described in the Last Section. But, if you are a researcher looking at change over time in the earth's land cover, how can you possibly figure out which humans created which changes?
This is a more difficult problem than it may seem at first. To illustrate the difficulty, take a moment and think about all of the places you have visited this week - different locations on the earth's surface. In many of them, you may not have directly changed the surface much, but you likely contributed indirectly to the need for a change. For example, every time you drive down a road, your car is just one of thousands of others on the same road. Whether you alone choose to drive on the road or not does not likely affect traffic, and ultimately the need for the road, or improvements to it. The same is true for any other single driver or car. But taken together, there are far more cars on a major highway than on a suburban street, and the highway will need to be larger, sturdier, and will require more repairs than the street. Your need to get from one popular place to another, along with everyone else's contributed a tiny bit to the need for a major interstate.
In the same way, each of our personal daily actions contributes a tiny little fraction that when added up can lead to major changes on the earth's surface. The planting of crops for food and fiber, the building of a new shopping center in response to rising demand, the cutting down of trees to make room for a new sub-division - none of these is traceable to the actions of a single person or family, but each only results from human actions.
In Nang Rong, these types of indirect impacts are common. One example is the impact of European farmers on the types of crops grown in Northeast Thailand. Many livestock farmers in Europe feed their animals pellets made from cassava, one of the crops described in Section 3. When these farmers change the number of animals they feed in Britain or Germany, or when preferences for cassava over other feeds change, the impact of these decisions is felt halfway around the world. Thai farmers may respond to the changing demand for cassava by planting more when demand is high or swtiching to another crop when demand falls. If demand should fall suddenly after the year's crop has already been planted, this can be disasterous for the Thai farmer, who may now have a very difficult time selling any cassava at all.
How Big Is Your Footprint?
One useful idea that has come about in recent years is that of an ecological footprint. Imagine a whole group of people walking down the beach. Some will leave very light footprints and others very deep ones. Some will be quite big, and others small. The overall size of the footprint depends on the size of the person, and the overall size of an ecological footprint depends a great deal on the size of the population associated with it. The depth of a footprint depends on both the person's weight and where on the beach they walk. A very heavy person walking on the hard sand near the water might make little impression, while that same person walking in the soft sand far from the water might sink far down. Ecological footprints, too depend on both the intensity with which a given population impacts the environment (for example, whether most of a population walks or instead drives big cars), and the environment in question (some environments are more fragile than others). Finally, some footprints will be washed away in a few short moments by the action of the waves, while others, farther from the water may last longer. So too, ecological footprints vary in the length of time that they make a difference on the environment. For example, a place where the plants are well adapted to fires may recover from a human-caused wildfire in just a few short years, while a location poorly adapted to fire may take decades or even centuries to recover from a freak forest fire. All of these ideas are neatly summarized in the concept of the ecological footprint: the overall impact a group of people leaves on the environment in which it lives.
Tracing Agricultural Impacts
There are, of course, changes to land cover that can be linked directly to a person or persons. One of the things that attracted us to Nang Rong, Thailand to do research was the fact that many of the families here directly farm the land, making it possible to examine the decision-making process of these families about changes to their land. When a farmer chooses to grow food on forested land owned by the family in order to feed a family, one might safely say that the farmer is responsible for the change in the land cover (from forest to cropland) for that property. While this sounds like an ideal situation in principle, it is seldom so easy in reality.
One obstacle is the way in which households match up with the lands they farm and change. Imagine that you wanted to go door-to-door in a village and ask every household about how they change the land cover. If the households were arranged as they are in figure A below, this might give you a fairly complete picture of the way the landscape is changing. Eleven houses and eleven parcels. But what if the households, rather than being arranged in such a tidy fashion were clustered together as they often are in Nang Rong District and as shown in figure B below? In this diagram, the members of each household do not live near their agricultural fields, and must travel some distance to reach them each day. Unless the villagers themselves keep some type of record, determining which farmers are responsible for which plots will require the researcher to follow each family out to its parcel. We will discuss this feature of life in Nang Rong in greater depth in Section 9 on village location.
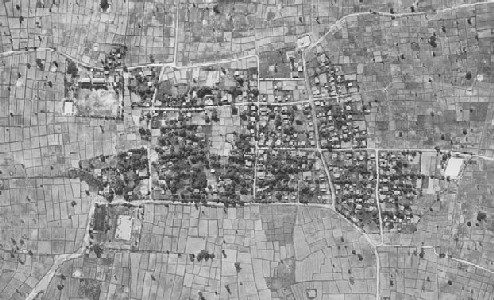
ABOVE: Villages in Thailand are commonly arranged in a "nuclear" pattern, surrounded by rice paddies and other non-occupied lands, which provides many advantages to the residents.
Complicating things further, many, if not most, farming households in Nang Rong District manage multiple separate plots of land. Some of this land may be good wet land for rice, while other parcels, or plangs, may be higher land a long way from the rice land that is used for growing cassava and other "upland" crops. Now the researcher must follow the family for many days, or separate family members to different parcels. In order to obtain a complete picture, a researcher might even have to visit the village over the course of several seasons, according to when a family uses each plot for different crops.
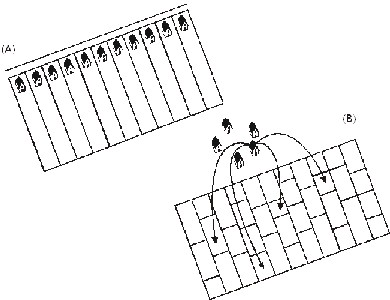
ABOVE: Figure A, a precise one-to-one relationship between houses and parcels in which the houses are located directly on the parcel. Figure B, a "one-to-many" relationship between houses and parcels in which the houses are removed from the parcels.
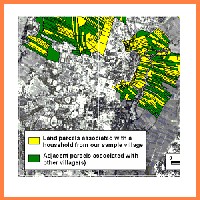
A third complication (and we will cease after listing three), is that social surveys are almost always conducted village-by-village. So what? Well, it turns out that in Nang Rong District, and many other regions of the world, asking every family in the village about the land they own provides an incomplete picture of land ownership. This point is illustrated clearly in the picture below. In the year 2000, our research time undertook the labor-intensive task of recording the location of every plang, or field, in the vicinity of each village, and then matching these up with the families that owned them. When this task was finally completed several years later, we found that in many villages much of the land was owned or used by families who did not live in the village. At the root of these challenges is the observation that land is a continuous surface, represented by the black and white photograph below, while humans and their activities are discrete, or have boundaries, as represented by the green and yellow patches. If your goal is to produce a complete picture of the changes specific humans make to the landscape, the inevitable result is a set of linkages that include gaps, overlaps, and other problems.
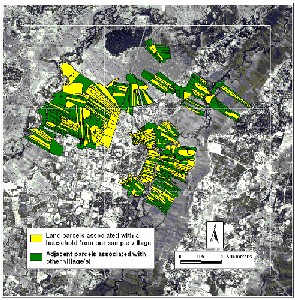
ABOVE: Map showing land parcels associated with our sample village and adjacent land associated with other village(s).
Methods and Madness
Now that you have some sense of the difficulty associated with matching up families and the parcels of land they use, even in this very "simple" agricultural setting, let's explore the nuts and bolts of how this "matching" actually takes place. You may recall from Section 5 that there were over 8000 separate households in the over 90 villages where we conducted our study. If most of these households have at least one plang, and many have multiple plangs, the amount of work involved in obtaining all of this information is overwhelming. Not surprisingly, as you also learned in Section 5, sometimes the best plans for investigating a subject need to be revised on the fly because they do not work like we had planned it.
There were at least three methods that we tried in order to make our job easier. Each was tested out in advance to find out how practical and reliable it was.
Flag method: Knowing that it would be very laborious for us to visit every plang with the users and record the positions, not to mention inconvenient for the farmers, we hit upon what seemed a great idea. We would provide each household with a number of flags bearing a unique number that they could place at the corners of their plangs the next time they visited them. Then, our team of geographers could come around even later and record the coordinates of each plang. Unfortunately, when we tested out this method, it was a failure. Households that used a plang but did not own it expressed concern about placing the flags on it, for fear that the actual owner might not approve. Also, the flags were often not tall enough to be seen easily above the tall rice growing in the paddies. Villagers feared that local children would be fond of the flags and frequently take them or move them, not realizing their purpose. In the end, we had to make a quick decision to abandon the flag method.
Household interview method: In this method, interviewers traveled with household members to each plang that they used and measuring the coordinates of the boundaries. After trying this method a few times, a map was substituted for an actual visit to the field, and the farmer was asked to identify the extent of each parcel. Neither of these approaches was suitable for use with all of the households we spoke with. With nearly 8,000 households in the sample, many or most of which have multiple plangs, traveling to every one was simply impossible. On the other hand, not everyone understood the maps well enough to accurately identify their plangs.
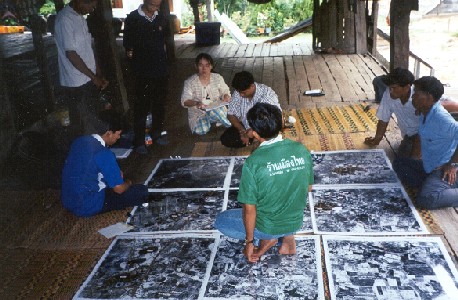
ABOVE: A map-based approach was an important part of our overall strategy for recording the land used by each household. In this photo, a number of respondents examine a 3 x 3 grid of aerial photographs of the region surrounding their village and attempt to link people and parcels.
Roving group interview method: Using a small group of knowledgeable villagers, we traveled through the plangs, asking about the users of each. While this method worked quite well in Nang Rong, it was highly dependent on the selection of the most knowledgeable informants possible. In the end, however, even this method proved too time consuming for use across the entire district.
Our eventual solution was a combination of aspects of each of these, but it is obvious that this challenging activity deserves more attention from creative people to find an efficient way to gather reliable data. Perhaps you can think of a new and better way to learn what we want.
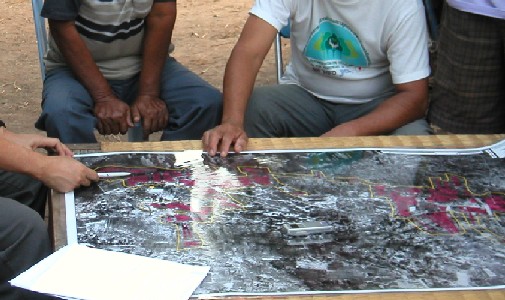
ABOVE: A Nang Rong team member points out a feature on an aerial photo during a recent interview project exploring the pattern of parcels surrounding a village center.
Global Positioning Systems
In all of the methods described above, one tool has become absolutely indispensable: the Global Positioning System handheld receiver. Global Positioning Systems (GPS) rely on a collection of at least 24 satellites that orbit the earth on multiple paths and provide highly accurate information to users on the ground about their precise position. In order for a GPS unit on the earth's surface to function properly, it must be able to communicate with at least 3 orbiting satellites at the same time. This requirement sometimes made GPS difficult to use in remote regions of Thailand, especially in the early years of the system's existence, when not all satellites were operational. Complicating matters further, the US government, which built the GPS system, periodically reduced the accuracy of civilian GPS units to protect US military personnel in conflicts such as the first Gulf War. Using special antennae, combined with readings on known coordinates, such as at landmarks like water towers, our team was able to work around this problem when it arose and obtain very precise measurements of the location of thousands of objects throughout Nang Rong district. These measurements provide a level of spatial detail seldom seen in large, longitudinal social surveys.
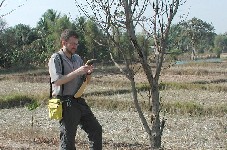 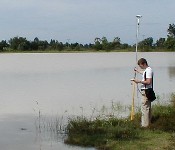 
ABOVE: Three of the Nang Rong spatial analysis team take some of the thousands of GPS measurements of position collected over the years in Nang Rong. L to R, Top to Bottom: 1. Phil Page, 2. Randy Pullen, and 3. Phil McDaniel.
|
|