Deforestation is a pressing concern in many developing countries. People cut down trees for many reasons - to clear land for agriculture, to provide wood for local building projects, and to profit from the sale of timber, just to name a few. These changes to forest cover have important implications for biodiversity and climate. One of the major tasks of the Nang Rong Project has been to better understand the relationship between changing people and the changing environment. In this section, we examine one major way to do that.
|
Not A Simple Process
Throughout history, there are many accounts of humans moving into regions and removing most of the trees, perhaps making room for growing food or in order to produce timber. Many of us have grown up with an understanding that some of the world's major forests, both tropical like the Amazon and temperate like the Pacific Northwest, were and may still be disappearing, sometimes rapidly. The image often created is of humans as destroyers of the environment.
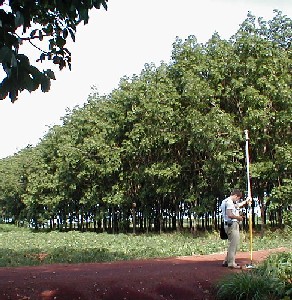
ABOVE: This photo might seem out of place at first. The Nang Rong team member is using one of the Global Positioning Systems discussed in section 7. But, behind him stands a grove of young trees, all about the same age. Such groves indicate that reforestation can also occur in Nang Rong, either through intentional planting or by letting a field go unplowed, or fallow, for many years.
We may be less familiar with the concept of "re-forestation" than we are with "de-forestation." Reforestation occurs when humans cease to remove trees and brush from a landscape. Quite frequently, the trees that grow back in place of those cut down are different species, and these may not provide the same benefits such as animal habitat that their predecessors did. But in any case, the image of humans as simply involved in a one-way process of change from more trees to fewer trees does not capture the dynamic processes going on. In recent years, environmental science and other fields have shifted to an image of humans and their environment in a state of flux. This idea is illustrated by the fact that a single plot of land may undergo cycles of clearing and reforestation many times.
Another point that is missed altogether in the concepts of "deforestation" and "reforestation" is that these represent changes to just one of the many types of land cover and land uses that an area of land could undergo. For these reasons, we tend to talk less about deforestation, and more about "land use change" or "land cover change". Land use refers to the purposes that humans devote a given region of land to, whereas land cover refers to the physical composition of the plant growth and other aspects of the surface, such as roads and manmade materials. These broader concepts allow us to step back and observe other transformations occurring on a landscape, such as the conversion of farmland to urban landscapes such as parking lots.
Great arguments rage about how much change is "normal" in environments, and even whether there is anything that can be called "normal", but an essential point from the discussion above is that not doing something to the environment could have as big an impact as doing something. Moreover, our impact does not cease when the chainsaws are packed up for the day. The long-term impacts of a major change like removing trees from a landscape, such as changing weather patterns, may play out over many decades, or even centuries. These impacts may not appear as drastic as the visual changes wrought on the landscape, but in fact they may be even greater.
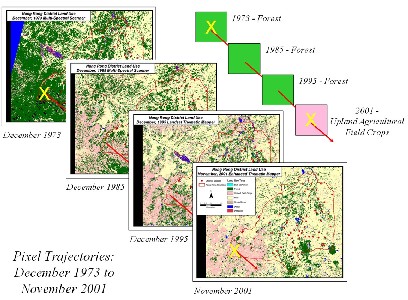
ABOVE: Although the diagram above may look complicated, just imagine standing in the same exact place for thirty years. What would you see? Possibly, as in this example, forest, forest, forest, and then suddenly an agricultural field, the result of human actions on the landscape.
Cause and Consequence
Unfortunately, when it comes to understanding land cover change, we have so far had an easier time figuring out what is causing it than in appreciating the consequences of these changes for both people and the environment. One of the major ways that we learn about the causes of WHAT??? is through the use of time-series of satellite images that depict the state of land cover over time. We do this using a GIS, where we "stack" these images on top of each other as data layers and observe what happens to a single place on the earth's surface over time. You can think of this as similar to drilling down into the earth and pulling out a "core" of rock as you go. As you move downward, it is as if you are moving back in time. By looking at the rock at any place along the core, you are able to, in effect, compare the characteristics of the earth's surface at different points in time. Another way of describing the change over time is the trajectory of the land cover or of the rock in the core.
You might be looking at the diagram above and wondering why it refers to "pixels." Like the computer screen in front of you, a satellite image is composed of hundreds of thousands of tiny squares called pixels. Each pixel represents some area on the earth's surface. Like a vast tile floor, with each tile colored differently, the pixels of a satellite image indicate the conditions on the surface of the earth over some small region. When data layers are stacked up, a "pixel trajectory" represents the path of the bullet.
In the diagram, if you stood at the exact spot on the surface of the earth that corresponds to the pixel chosen, and were somehow able to watch time fast-forward, you would see forest, forest, forest, for many years. Then, at some point between 1995 and 2001, you would see a human being come along and remove the forest, converting the land to grow "upland" crops like cassava. With the GIS, we are able to watch what happens to the hundreds of thousands of different pixels representing the entire District simultaneously. Because of satellite images, if a tree falls in a Nang Rong forest, we can know about it without needing anyone to be there.
The Grand Sweep of Time
Now that we have a vast collection of data that records the state of the earth's surface at every small point, or pixel, in Nang Rong, and over time too, the next step is to describe the changes occurring and ask why. It turns out that, in spite of what was said earlier, the term deforestation is a pretty accurate description. As you may recall from the images in Section 9, Nang Rong went from being heavily forested to mostly cleared for agriculture over the period from the 1950s to the present. Many smaller patterns and trends were also occurring, but the speed and scale of the deforestation and its implications for people living there have made it the central focus of our studies. Nevertheless, we should not forget that it is just one piece of the complex web of transformations occurring in the landscape.

ABOVE: Although much of the forest in Nang Rong has been cleared to make way for agriculture, the farmers frequently leave a few large trees standing at the edges of their fields. These trees provide much desired shade during the hottest part of the day where the workers can sit, rest, and eat.
In trying to understand how deforestation occurs - which places get deforested first and which later, which areas are avoided altogether, the motives for deforestation, and who actually is responsible - we have developed a model of human action on the landscape. A model, in scientific terms, is usually a simplified description of how we think a process works in the real world. Models, when they are reasonably valid and well-tested, can be used to predict what may happen in the future, or they may help to explain changes that have already occurred. While you might think that if we can explain how things got the way they are that we should automatically also be able to predict the future, but if the factors shaping the landscape now are different than they were in the past, then understanding the past is still no guide to the future.
Agent Based Models
Our goal so far has been to create a model that can simulate the changes in land cover over the 40 to 50 year period for which we have information. We have been especially interested in the factors that lead a particular area, often a single pixel, to become deforested, but to model the overall phenomenon of deforestation, we shift our attention to modeling the overall pattern as accurately as we can, while sacrificing individual pixel accuracy if necessary. Such an approach is reminiscent of the ecological footprints that were discussed in Section 7. One type of model that we use to simulate the land cover changes is called a cellular automata model. The model is based on the smallest unit in spatial studies: the pixel, or cell. A cell can vary in size depending on the resolution of the image, but is always the smallest possible unit for a given quality of data. The automata part of the term refers to the automatic "behavior" of the cell in response to what is going on around it. This "behavior" is in reality a set of simple rules that tell us what will happen to the land cover in a given parcel as a result of changes occurring in its neighbors. You might recall the 3 x 3 grid of aerial photos shown in Section 7. If we were concerned with modeling deforestation occurring in the central cell (in this case a very big cell), we might look to the 8 cells surrounding it to see if deforestation has already occurred in any of them. Such a principle is based upon the assumption that humans tend to deforest systematically: rather than jumping over a forested cell to get to another forested cell, they will first deforest the intervening cell, and then the next cell. An analogy might be made to the early video game from the 1980s called "PacMan," in which a circular yellow hero devoured food pellets in a linear fashion - it was impossible to skip over a pellet, or leave it in place.
Another useful analogy in understanding how agent based models operate in practice is the simple phenomenon of the "wave" at a major sports stadium. If you have ever participated in doing the wave, you know that the basic rule is "stay seated until the wave approaches very close, then stand and wave your hands, sitting back down quickly afterwards." Because nearly everyone in the stadium has learned this simple rule, an amazing coordinated action can be performed even though each person is simply following a rule for him or herself. In the same way, cells in a cellular automata model act alone in response to their neighbors, but collectively mimic or represent complex human/environment interactions on the landscape. If we can correctly specify most of these rules we may get close to creating a model that acts very much like what we observed happening in the real world. We will continue looking at models of land cover change in the exercises section.
|
|