What's the Deal?
There is more talk in the news every day about the idea of "global warming." The term first emerged in the 1960s, when scientists from a many disciplines were asked to describe potential environmental risks the United States would face in the years to come. While the phrase "global warming" is by far the most popular way to describe the changes observed over the past century in the global climate, it can also be misleading, and may be responsible for some confusion. For many of the same reasons that "land cover change" was preferable to "deforestation," a better phrase to describe what is occurring worldwide might be "global climate change." This term reflects the fact that while average temperatures are rising worldwide, there are in fact some places on earth where the average temperature will decrease over a small region. Meanwhile, some places may grow dryer, others may see more rain, and so on. The reason for all of this is that changes in global weather patterns and other intricate and interconnected global systems caused by this overall temperature increase may set up new local weather patterns. One of the most serious impacts of global climate change being predicted is an increase in extreme weather events of all types, as well as in the severity of these events. It is unlikely that a single region of the earth will experience all of the extremes, but many places may experience one or more of them, creating new challenges for the residents there.
Change on the Homefront
Is there any evidence of this in Nang Rong? The safest answer to this question is maybe. With so many factors to consider it is risky interpreting a single change as evidence for such a massive shift as global climate change. This is why the scientific researchers who study climate change amass giant collections of many different types of information and measurements before drawing any generalizations or conclusions. In other words, not all claims are of equal value. A claim based on a single source of information is typically not enough to outweigh those based on multiple sources of information that are all in agreement with one another.
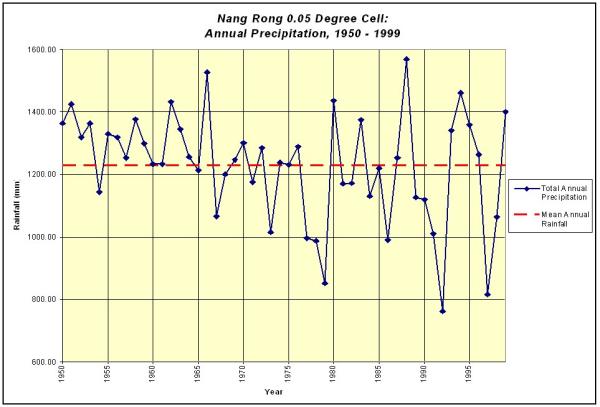
Nevertheless, simple measurements from Nang Rong are consistent with an overall picture of an increase in the variability of weather, and especially rainfall. Let's take a look. The graph below may appear familiar. It is the same that was used in Section 3 on climate to show the yearly rainfall in Nang Rong District, and the average over many years. In that section, we determined both the high and low rainfall records and compared them to the average for the past 30 or so years. As is often the case, however, there is still more to be learned from the graph.
The year 1975 divides the graph roughly in half. Do you notice a difference between the years before 1975 (to the left) and those after 1975 (to the right)? Recall from the Section 3 exercises that both the record high and low rainfalls have occurred since 1985. In fact, 7 of the 8 most extreme high and low rainfall years have occurred after 1975 and thus fall on the right half of the graph. Notice that Nang Rong has, in effect become both wetter and drier from year to year. A precise way to describe this trend is to say that the variation in total annual rainfall seems to have increased over the past 30 years.