Forecasting COVID-19: A conversation with Paul Delamater
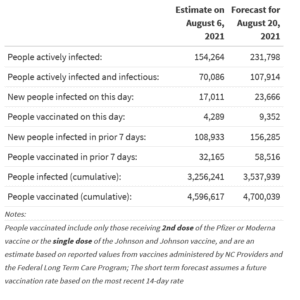
For the past several months, Paul Delamater has been working with a team of researchers to forecast COVID-19 cases across North Carolina. The NC COVID-19 dashboard shows up-to-date estimates and future forecasts of SARS-CoV-2 infections, COVID-19 cases, and (coming soon) COVID-19-related hospitalizations and deaths in North Carolina.
Here are his answers to some questions about what may happen in NC in the coming weeks.
What do your forecast models show for fall?
I don’t really forecast out that far because my models simply extend what’s been happening recently out into the future. I think that they’re useful for understanding what could happen in the near future if nothing changes. For the next couple of weeks, my models show that cases are going to continue to rise, as there are still many people who remain susceptible to infection.
How does that compare to last year?
Right now, it looks like transmission will be higher when school starts this year than it was when school started last year. I am very concerned for elementary and middle schools, where there will be a lot of unvaccinated people sharing space. While children have had much better outcomes than adults (when infected), I am concerned that they will spread to vulnerable people in their homes and communities.
How do you calculate this?
I use a compartmental model called an SEIR model, which categorizes people as Susceptible, Exposed, Infectious, and Recovered, with categories added for people who have been vaccinated and are immune (recovered). In my model, I calculate new infections, then adjust for testing volume to estimate lab-confirmed cases (which I compare to observed data from NCDHHS for validation).
How should different counties with different rates of infection / vaccination use this model?
We just released a metric that basically captures the risk of a massive, quick outbreak for each county based on people infected, people susceptible, and people immune.

