The latest COVID-19 science — easily understood through a new dashboard
The world has been living with the COVID-19 pandemic for nearly a year and we still have so many questions. Even when questions are answered, however, the new knowledge may not filter out to everyone who needs it.
Enter researchers with the University of North Carolina at Chapel Hill, led by 15 faculty members at UNC’s Gillings School of Global Public Health.
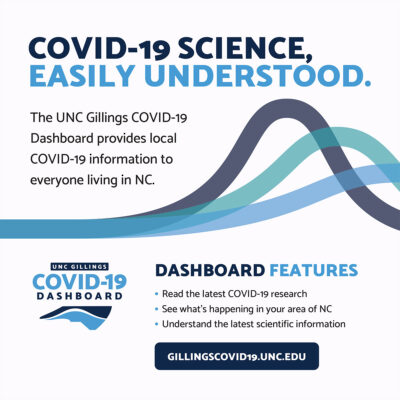
Launched on December 18, 2020, the UNC Gillings COVID-19 Dashboard provides a resource center for information about COVID-19 in North Carolina. Using modern epidemiologic tools, the dashboard is a resource for policy makers, researchers and anyone interested in learning more about COVID-19 in the state.
 The dashboard provides county-level profiles and interactive COVID-19 data visualizations for North Carolina, allowing users to see what’s happening in their area of the state by mapping demographics, health outcomes, economic characteristics and more.
The site also presents the latest COVID-19 scientific findings for a general audience by distilling the key points of research articles into a Frequently Asked Questions (FAQ) section. FAQ topics include “What are the different types of tests for COVID-19?” and “Are you really immune after COVID-19 infection?” and “Are the new COVID-19 vaccines safe?”
A glossary defines key terms like “positivity” and “herd immunity,” as well.
“Understanding the burden of COVID-19 across North Carolina is essential in helping local officials determine when and where to increase and/or decrease support services,” the researchers write in an overview of the dashboard. “It also helps scientists and public health officials better understand the epidemiology of the virus, including causes, predictors of outcomes, case- and infection-fatality rates and the true prevalence of infection.”
UNC Gillings scientists also created unique resources for anyone interested in diving deeper into their understanding of COVID-19 and SARS-CoV-2 (the virus that causes COVID-19). These include white papers, information about studies happening across the state, maps of specific vulnerable populations, and tools for data validation and improving testing yield.

Dr. Penny Gordon-Larsen
“We are seeing an upward trend in case numbers in the state. The Gillings COVID-19 Dashboard provides context for the rise in cases and also provides data visualizations to help identify N.C. areas and populations at highest risk,” says Penny Gordon-Larsen, PhD, CPC Faculty Fellow and associate dean for research at the Gillings School. “The dashboard offers something for everyone: You can choose to wade into the shallow end of the pool with maps, visualizations and FAQs, or you can dive quite deep if you’re a researcher looking for the science or for an app to help analyze test results.”
The core project team included 15 public health researchers from the Gillings School and one member of UNC’s Department of Medicine. Faculty, staff, postdoctoral research fellows and students from multiple departments at the Gillings School also contributed to academic practice translation, the development of mobile research apps, and project management and overall support.
Other key UNC-Chapel Hill partners included the Sheps Center for Health Services Research, Carolina Demography, the Frank Porter Graham Child Development Institute, the North Carolina Institute for Public Health at the Gillings School, the North Carolina Translational and Clinical Sciences Institute, and student support from the Hussman School of Journalism and Media.

Dr. Lori Carter-Edwards
Representatives of these organizations worked closely with community members through outreach led by Lori Carter-Edwards, PhD — a faculty member in the Gillings School’s Departments of Health Behavior and Epidemiology and the Public Health Leadership Program — to learn what key stakeholders from around the state wanted out of the dashboard.
Members of the dashboard team also are involved in ongoing COVID-19 testing work in North Carolina, including wastewater testing, surveillance activities and testing events, and they continue to develop new statistical and epidemiologic methodology as needed to aid the pandemic response.
The dashboard project was supported by the North Carolina Policy Collaboratory at UNC-Chapel Hill with funding from the North Carolina Coronavirus Relief Fund established and appropriated by the N.C. General Assembly.
This piece was originally published by the Gillings School of Global Public Health.
